Admin User Interface
Graph
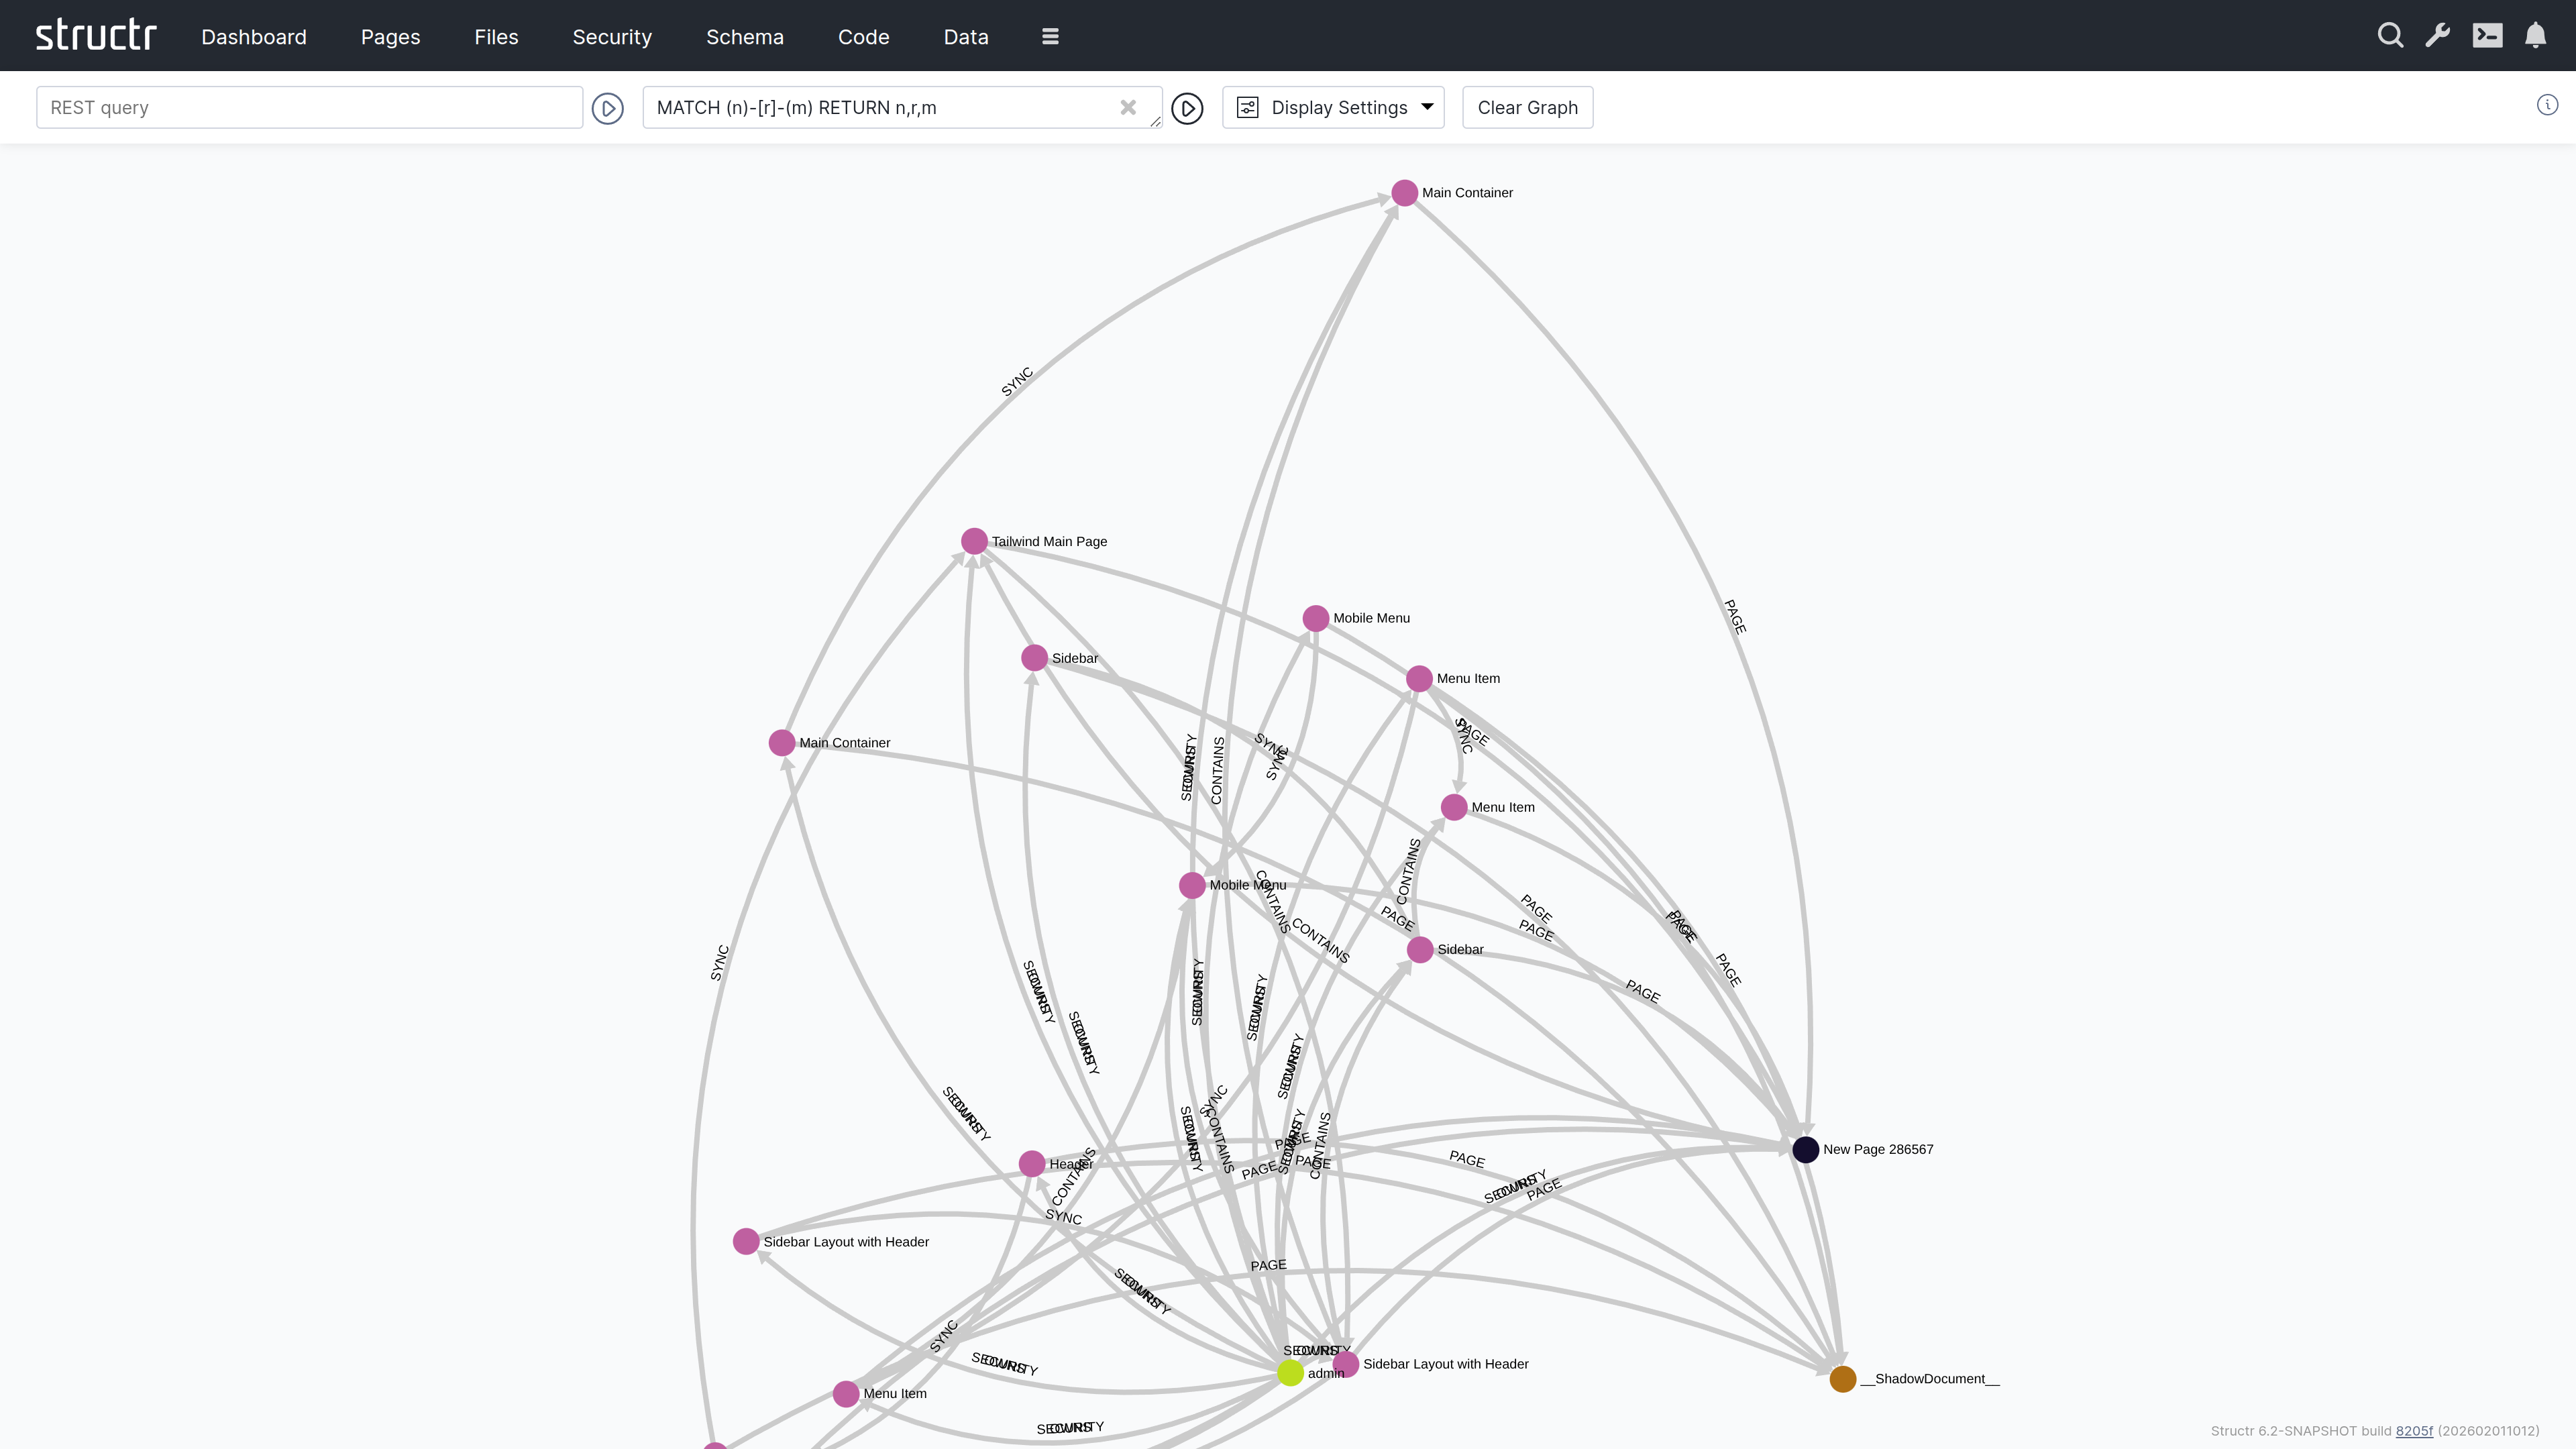
The Graph area is an interactive graph explorer where you can visualize your data objects and their relationships. This area is particularly useful when you need to understand the connections between objects in your database, explore how data is interlinked, or navigate complex relationship structures. By starting from a query result, you can progressively expand the visualization to discover related objects step by step. By default, this area is hidden in the burger menu.
Querying Data
The header contains two input fields for specifying which data to display.
REST URL
In the left input field, you can enter a REST URL to load objects. The results will be displayed as nodes in the graph visualization.
Cypher Query
In the right input field, you can enter a Cypher query to further filter or transform the results.
The Graph Visualization
Each object returned by your query appears as a filled circle on the canvas, with its name displayed as a label.
Exploring Relationships
When you hover over a node, additional colored circles appear around it. Each colored circle contains a number indicating how many outgoing relationships of a particular type exist. The colors distinguish different relationship types.
Click on one of these colored circles to follow all relationships of that type. The related nodes are then added to the visualization, and you can see the connections between them. This way, you can progressively navigate through your data graph, expanding the view step by step.
Display Options
A dropdown menu next to the input fields provides configuration options:
Display Options
Two checkboxes control what’s shown in the visualization:
- Node Labels – Shows or hides the names on nodes
- Edge Labels – Shows or hides the names on relationship lines
Layout Algorithm
You can choose between two different layout algorithms that determine how nodes are arranged on the canvas.
Clear Graph
This button resets the visualization, removing all displayed nodes and relationships so you can start fresh.